A beginner sees $12,000 land in their Amazon account and tells everyone they made $12,000 that month. They didn’t. After the supplier, the freight, the Amazon fees, and the ad spend, the real take-home on that $12,000 was closer to $4,500. That gap is the whole story of Amazon FBA income, and almost nobody talks about it honestly. We’ve onboarded 47 beginners into Amazon launches since 2022, and we currently run stores doing $200,000 a month for paying clients. So this post isn’t a guess. It’s what year-1 earnings actually look like when you separate the number people brag about from the number that hits your bank.
Revenue is not income, and that confusion ruins year 1
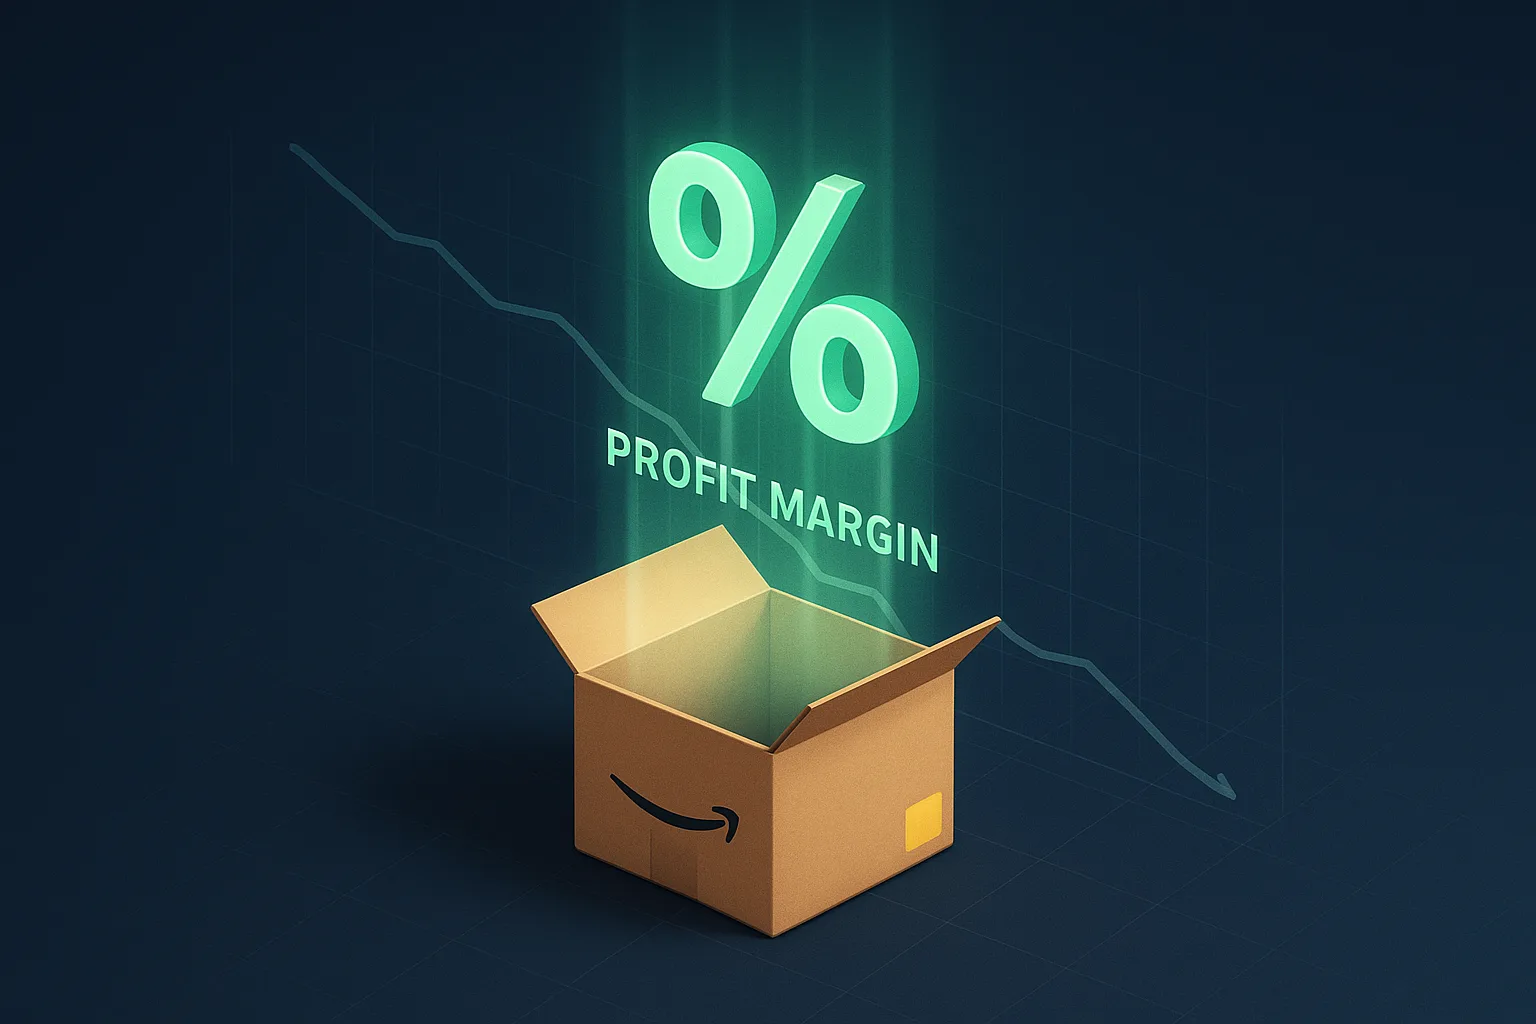
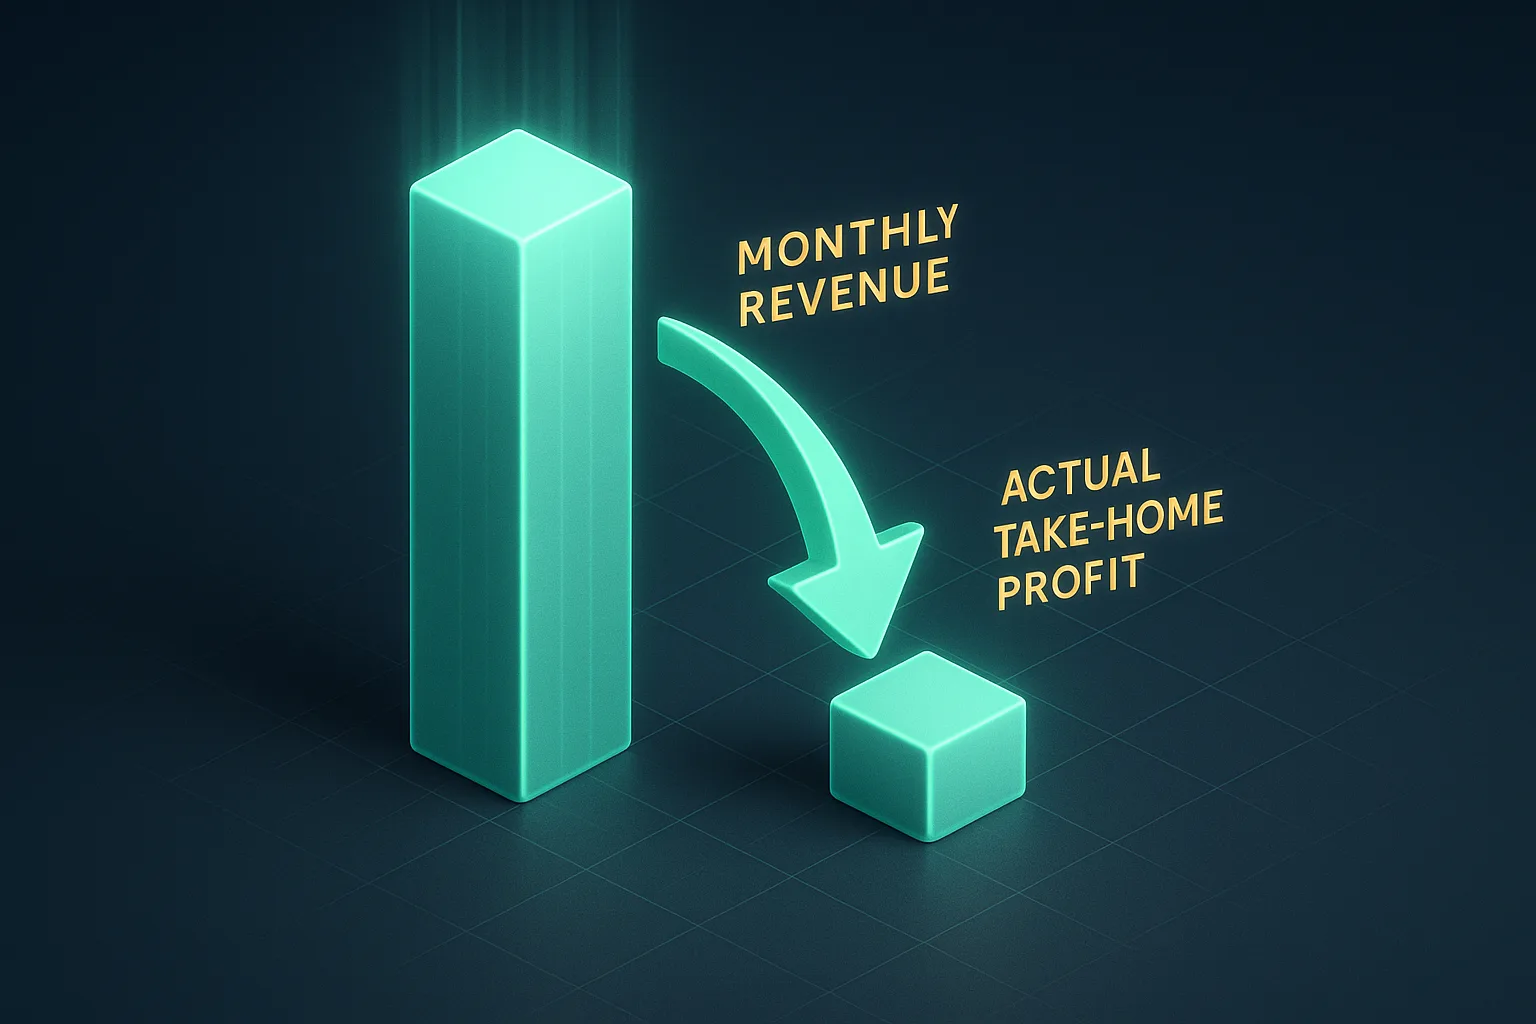
The single biggest mistake new sellers make with money has nothing to do with sourcing or PPC. It’s that they confuse revenue with income. Revenue is the total amount of money your sales collect before any cost comes out. Income is what’s left after every cost is paid. They are not close to each other.
Here’s the math we teach every client, straight from a real product example. You sell a product for $40. You move 300 units in a month. Your revenue is $12,000. That number feels incredible. But it isn’t yours.
Now subtract the costs on those 300 units:
- Manufacturing (what you pay the supplier): about $10 per unit
- Shipping to Amazon (freight): about $3 per unit
- Amazon FBA fee (storage and fulfillment): about $8 per unit
- Advertising (PPC to get the sale): about $4 per unit
That’s $25 of cost on every $40 sale. Across 300 units, your total cost is $7,500. So your actual profit on that “$12,000 month” is $4,500. That works out to a 37.5% profit margin, which is a strong result. We aim for a minimum of 30% net margin after every cost on the products we run.
So when you read that someone “made $30,000 on Amazon last month,” what they almost always mean is they did $30,000 in revenue. At a healthy 30% margin, their income was around $9,000. At a thin margin, which is where most beginners live in year 1, it was a lot less. Some of those “I did $30K” posts are sitting on a loss once you add returns and the ad spend they conveniently leave out.
If you remember one thing from this entire post, make it this: when you ask “how much can I make selling on Amazon,” you have to decide whether you’re asking about revenue or about money you keep. They are different questions with different answers, and people sell courses by blurring the two.
What year-1 income actually looks like across 47 beginners
Across the 47 beginners we’ve onboarded since 2022, plus the handful we’ve advised informally (which is how the round number “50” in the title shows up), year-1 income falls into a few honest groups. This is operator observation, not a formal survey, so I’ll give you patterns rather than fake precision.

The first group never makes a single dollar in year 1, because they never get a product to market. They research for months, second-guess every niche, and quit before they ship. This group is bigger than anyone admits. Most beginners who fail at Amazon don’t fail at selling. They fail at deciding.
The second group launches and ends year 1 around break-even or at a loss. This is the largest group of people who actually ship. They picked a generic product, or a saturated niche, or they mispriced, and the launch costs plus ad spend ate everything the sales brought in. A beginner in this group might do $40,000 or $60,000 in revenue across the year and still end up roughly even, or down a few thousand dollars, once you account for the launch cash they deployed.
The third group reaches real profit by month 6 to 12. These are the sellers who got the product selection right, baked in differentiation before sourcing, and held their nerve through the launch ramp. By the back half of year 1, they’re clearing a few thousand dollars of profit a month, which annualizes into real money in year 2.
There’s a small fourth group at the top who do unusually well in year 1, usually because they already had capital, picked a great first product, and executed cleanly. They’re real, but they’re the exception, and using them as your baseline expectation is how you set yourself up to feel like a failure at month 4 when you’re actually on a normal track.
There’s one more layer that makes year-1 income look smaller than it is, and it’s a good problem to have. The sellers in the third group, the ones who actually reach profit, usually don’t get to spend that profit. They pour it straight back into the next inventory order. When a product is selling and climbing in rank, the worst thing you can do is run out of stock, so every dollar of early profit goes into ordering more units, often a bigger order than the last one. That’s the right move for the business, but it means a profitable year-1 seller can still feel broke, because the money is sitting in inventory on its way to an Amazon warehouse, not in their checking account. This is normal. It’s the difference between income the business earns and income you can personally withdraw, and in year 1 those are rarely the same number.
The honest headline: most beginners do not make meaningful take-home income in their first 12 months. They either don’t launch, or they launch and spend year 1 recovering their startup costs and feeding profit back into inventory. That’s not a reason to quit. It’s a reason to plan for it so you don’t run out of cash and patience before the product turns the corner.
The income timeline: month 1 is nothing like month 12
Amazon FBA income is not a flat line. It’s a ramp, and the early part of the ramp is slow on purpose. When you launch, your listing has no reviews, no rank, and no sales history. Amazon’s algorithm has no reason to show it to anyone yet. So month 1 is almost always a money-losing month, and that is normal.
Here’s the timeline we see on a launch that’s working:
- Month 1: You’re spending on PPC at roughly $50 a day, the operator floor for a launch, and getting very few organic sales. You are paying to buy your first reviews and rank signals. Net cash flow is negative.
- Months 2 to 3: Reviews start landing, organic rank starts climbing on a few keywords, and PPC ACoS begins dropping from launch highs toward something workable. You might cross into breakeven on a good month.
- Months 4 to 6: If the product is right, this is where it turns. Organic sales start carrying more of the load, your ad cost as a share of total sales drops, and you see your first genuinely profitable months.
- Months 6 to 12: The product compounds. More reviews, better rank, steadier sales, lower ad dependence. This is where the income people talk about actually shows up.
One real example from our own launches makes the timeline concrete. A product we ran in the Health and Household category back in 2023 hit $10,000 a month in revenue within about six months. But I want to be honest about why it took that long: it took six months only because we went out of stock. It was a test order, the demand was higher than the inventory, and we sold out. The moment we restocked, it hit $10,000 a month in that first month back, and it kept growing. Before we ran out, we had the Amazon’s Choice badge on 279 keywords and were ranking organically on over 950 keywords. The product was working from early on. The income just couldn’t show up until the inventory could.
That’s the part beginners underestimate. Your income in year 1 is gated as much by inventory cash flow and the launch ramp as it is by whether the product is good. A great product that you under-order will still produce a slow, choppy income curve because you keep selling out.
Three real year-1 outcomes: the full spread
Numbers in a table are abstract. Real launches aren’t. Here are three actual outcomes from products we’ve run, anonymized to category level, that show the real spread of what year-1 income looks like.

The win. A Sports and Fitness launch we ran for a client (Travis) priced 20% above the category average and bundled the core product with a hand band, a wrist band, and a small carrying bag, with all four items visible in the main image. Month-1 ACoS was around 25%, and TACoS was around 13%, which means it was profitable from the first 30 days. The listing held first-page rank from launch onward with no mid-launch drop. This is what a clean year-1 launch looks like: profitable early, climbing through the year, and on track to be a real income product in year 2. It worked because the buyer could see four items in the thumbnail versus a competitor’s one item, and clicked ours even at the higher price.
The break-even. A Home and Kitchen product, the kind of mid-retail item a lot of beginners start with. We applied a tight niche checklist before sourcing and hit a 30% net margin with a 15% month-1 ACoS, which is a strong launch. But the all-in cash to get it live was about $8,450: $150 in samples, $4,500 for the first 500-unit production order landed, $800 for photography and listing content, and $3,000 in launch PPC. Even a healthy, profitable product spends a big chunk of year 1 just earning back that $8,450 before the seller sees real take-home. The product was a success. The year-1 income, after recovering the launch cost, was modest. That’s normal, and it’s fine.
The loss. One of my own early products was a “premium” power tool organizer. Competitors sold theirs around $35 to $40. Mine cost more to make because I sourced better materials, so I had to price it at $59.99 to clear a profit. The CPC in that niche was high, around $1.60 a click, and my conversion rate was terrible. Buyers saw a $60 product next to $40 products, my main image looked like everyone else’s, and they clicked my ad (costing me $1.60) and then bought the cheaper one. I burned through PPC budget getting clicks and no sales. In the end I had to liquidate the entire inventory. Complete loss. The lesson cost me real money: a better product earns you nothing if you can’t show the buyer why it’s better in the first three seconds.
Three products, three completely different year-1 income results. Same operator team in two of the three cases. The variable that moved the outcome was not effort. It was product selection and differentiation, decided before a single unit was ordered.
What separates the earners from the people who make nothing
After 47 client launches, the difference between the beginners who earn in year 1 and the ones who don’t comes down to a short list. None of it is luck.
The first thing is that earners actually ship. The people who make zero usually aren’t bad at Amazon. They never launch. They keep “researching” because deciding feels risky and researching feels safe. The fastest beginners we work with pick a category in week 1, validate a few products in week 2, choose a supplier in week 3, and move. The slow ones are still comparing niches at month 7. Action is the filter, not intelligence.
The second thing is differentiation baked in before sourcing. Every product that failed long-term in our portfolio failed for the same reason: it was a generic product, the same physical item five other sellers were offering, with nothing different about it. When products are interchangeable, buyers default to the cheapest one, and you get pulled into a price race you can’t win. We managed one client’s generic massage tool for a full year. Every tactic we tried (PPC, ASIN targeting, listing refreshes) lifted sales for two to four weeks, then they declined again. After 12 months of that pattern we told the client the truth: the product itself was the problem, not the management. You cannot add differentiation after the inventory ships. It has to be designed in before you order. A simple way to find it is to look hard at the saturated niche you’re entering and decide what you’ll put in the main image that nobody else has.
The third thing is reading the niche before sourcing, not after. The earners screen out bad categories at the research stage. One filter alone catches most disasters: if the top sellers in a niche can’t get above a 4.5 average star rating with all their effort, the category itself is returns-prone, and your product will inherit that gravity no matter how well you execute. We learned that the hard way on a vegetable chopper launch that looked great for 90 days and then bled margin to returns over months 4 through 12.
The fourth thing is surviving the slow part. The earners expect month 1 to lose money and don’t panic. The quitters see a negative first month, decide Amazon is a scam, and bail right before the ramp would have turned. The income is on the other side of the slow part. You have to be funded and patient enough to get there.
Revenue versus take-home: the real math at every level
People love to ask “how much can I make on Amazon,” so let’s put real numbers against it. The table below shows what monthly revenue actually translates to in take-home income at the 30% net margin we target, versus the thin 10% margin a lot of beginners actually run in year 1 before they tighten their costs.
| Monthly revenue | Take-home at 30% margin | Take-home at 10% margin |
|---|---|---|
| $5,000 | $1,500 | $500 |
| $10,000 | $3,000 | $1,000 |
| $20,000 | $6,000 | $2,000 |
| $30,000 | $9,000 | $3,000 |
| $50,000 | $15,000 | $5,000 |
Two things jump out of that table. First, the margin matters more than the revenue. A seller doing $10,000 a month at a 30% margin out-earns a seller doing $20,000 a month at a 10% margin, on half the revenue and half the cash tied up in inventory. Chasing revenue while ignoring margin is how people stay broke at high sales numbers. Second, the difference between a 10% and a 30% margin is mostly product selection and differentiation, not penny-pinching on supplier cost. The premium-priced bundle that wins the click runs a healthy margin. The generic product in a price war runs a thin one, if it runs a positive one at all.
Now layer year 1 on top. Say you hit $10,000 a month in revenue by month 6 at a 30% margin, so $3,000 a month in profit for the back half of the year. That’s $18,000 in second-half profit. But you deployed roughly $8,450 to launch, and your first few months were break-even or negative. Net it out and a genuinely successful first-year launch might leave you a few thousand dollars ahead, not the “six-figure first year” the ads promise. The real money is year 2, when the launch cost is behind you and the product is compounding. Year 1 is the investment year. Plan your cash for that, and you’ll still be standing when the income shows up.
When to learn it yourself versus get the framework handed to you
You can absolutely figure all of this out on your own. The information is out there, scattered across a thousand YouTube videos and forum threads, and if you have the time to assemble it into a working sequence, do that. Plenty of people have.
The reason most beginners spend year 1 at break-even isn’t that the information is secret. It’s that they learn the costly lessons in the wrong order, by losing real money, the way I lost real money on that power tool organizer. The revenue-versus-profit confusion, the differentiation rule, the niche screen, the launch ramp: each one is cheap to learn from someone who already paid for it, and expensive to learn by paying for it yourself. If you’d rather get the whole operator sequence in order instead of stitching it together from scattered videos, that’s exactly what our $27 starter course is for. It’s the same framework we run with paying clients, condensed.
Either path works. What doesn’t work is launching blind, confusing revenue for income, and quitting at month 3 when the ramp hasn’t turned yet. That’s the path that produces the “I made nothing on Amazon” stories.
Frequently asked questions
How much can a beginner realistically make on Amazon FBA in year 1?
Honestly, most beginners make little to no take-home income in year 1, because they spend it recovering the $5,000 to $9,000 it costs to launch. A well-run first product might be a few thousand dollars ahead by month 12, with the real income arriving in year 2 once the launch cost is paid back and the product compounds. The sellers who claim big first-year numbers are usually quoting revenue, not profit.
What is a good profit margin for Amazon FBA?
We target a minimum of 30% net margin after every cost, including manufacturing, freight, Amazon FBA fees, and PPC. A 30% to 37% margin is a strong, healthy result. Many beginners run a 10% margin or thinner in year 1 because they picked a generic product and got pulled into a price war. The margin is mostly decided by product selection and differentiation, not by squeezing the supplier.
Why is my Amazon revenue high but my income low?
Because revenue is everything your sales collect before costs, and income is what’s left after. On a typical $40 product, roughly $25 of every sale goes to manufacturing, freight, Amazon fees, and ads, leaving about $15. Add returns and your real take-home shrinks further. A high revenue number with low income almost always means a thin margin, which usually traces back to a generic product or mispriced listing.
How long does it take to make money on Amazon FBA?
On a launch that’s working, the first genuinely profitable months usually arrive around month 4 to 6, with real income building through months 6 to 12. Month 1 is almost always a loss because you’re paying for reviews and rank with PPC before organic sales kick in. Going out of stock is the most common thing that stretches this timeline, so order enough inventory to ride the demand.
Is Amazon FBA still worth starting in 2026?
It can be, if you go in with realistic expectations and enough cash to survive the investment year. The sellers who do well treat year 1 as the year they buy their position (covering launch costs and building rank) and year 2 as the year they collect on it. The ones who fail expect fast income, confuse revenue with profit, and quit during the slow ramp. The model still works. The fantasy timeline doesn’t.
How much money do I need to start Amazon FBA?
A realistic first launch runs around $5,000 to $9,000 all-in, covering samples, the first production order, photography, and launch PPC, plus a cash float to survive the first inventory cycle. We break the full line-by-line numbers down in our Amazon FBA startup cost breakdown. Underfunding the launch, especially the PPC budget, is one of the most common reasons a good product produces no year-1 income.
The bottom line
Amazon FBA income in year 1 is mostly a story about the gap between revenue and take-home. The number people quote is revenue. The number that matters is profit, and after manufacturing, freight, Amazon fees, ads, and returns, it’s a fraction of what shows up on the dashboard. Most beginners spend year 1 recovering their launch costs, a smaller group reaches real profit by month 6 to 12, and a lot never launch at all. The sellers who earn aren’t smarter. They ship fast, differentiate before sourcing, screen the niche before ordering, and stay funded through the slow ramp. We’ve watched all of this play out across 47 client launches while running stores doing $200,000 a month. Plan for year 1 to be the investment year, protect your margin over your revenue, and the income shows up in year 2.